This post is about measuring the time (≈ CPU cycles) needed to execute a small piece of code. The gist:
- Modern processors have a Time Stamp Counter. It’s incremented at every cycle
and can be read using the
RDTSCinstruction. - On some processors, this is sufficiently precise to distinguish executions whose length differs by 3-5 instructions.
- On other processors, the result is unsuitable for benchmarking.
The rest of this post contains sample code to measure CPU cycles, and describes an experiment that I performed to measure the accuracy and overhead of this method.
Much information about using the time stamp counter and the RDTSC instruction
are found in an Intel white paper: How to Benchmark Code Execution
Times. John Regehr also has a blog post on this topic.
An experiment on using the time stamp counter
Based on the Intel paper and additional hints from StackOverflow, I’ve put together a small experiment. You can download it here, together with all the results: timing_bench.tar.bz2
The benchmark measures the number of cycles taken to execute the following loop
(where n_ops is a compile-time constant and foo a volatile int):
for (int i = 0; i < n_ops; ++i) {
    foo = 3;
}
The results are… very surprising. At least for me. Let’s start with the graphs. Click to zoom.
-
Results: Workstation -
Results: Laptop -
Results: Server -
Details: Workstation -
Details: Laptop -
Details: Server
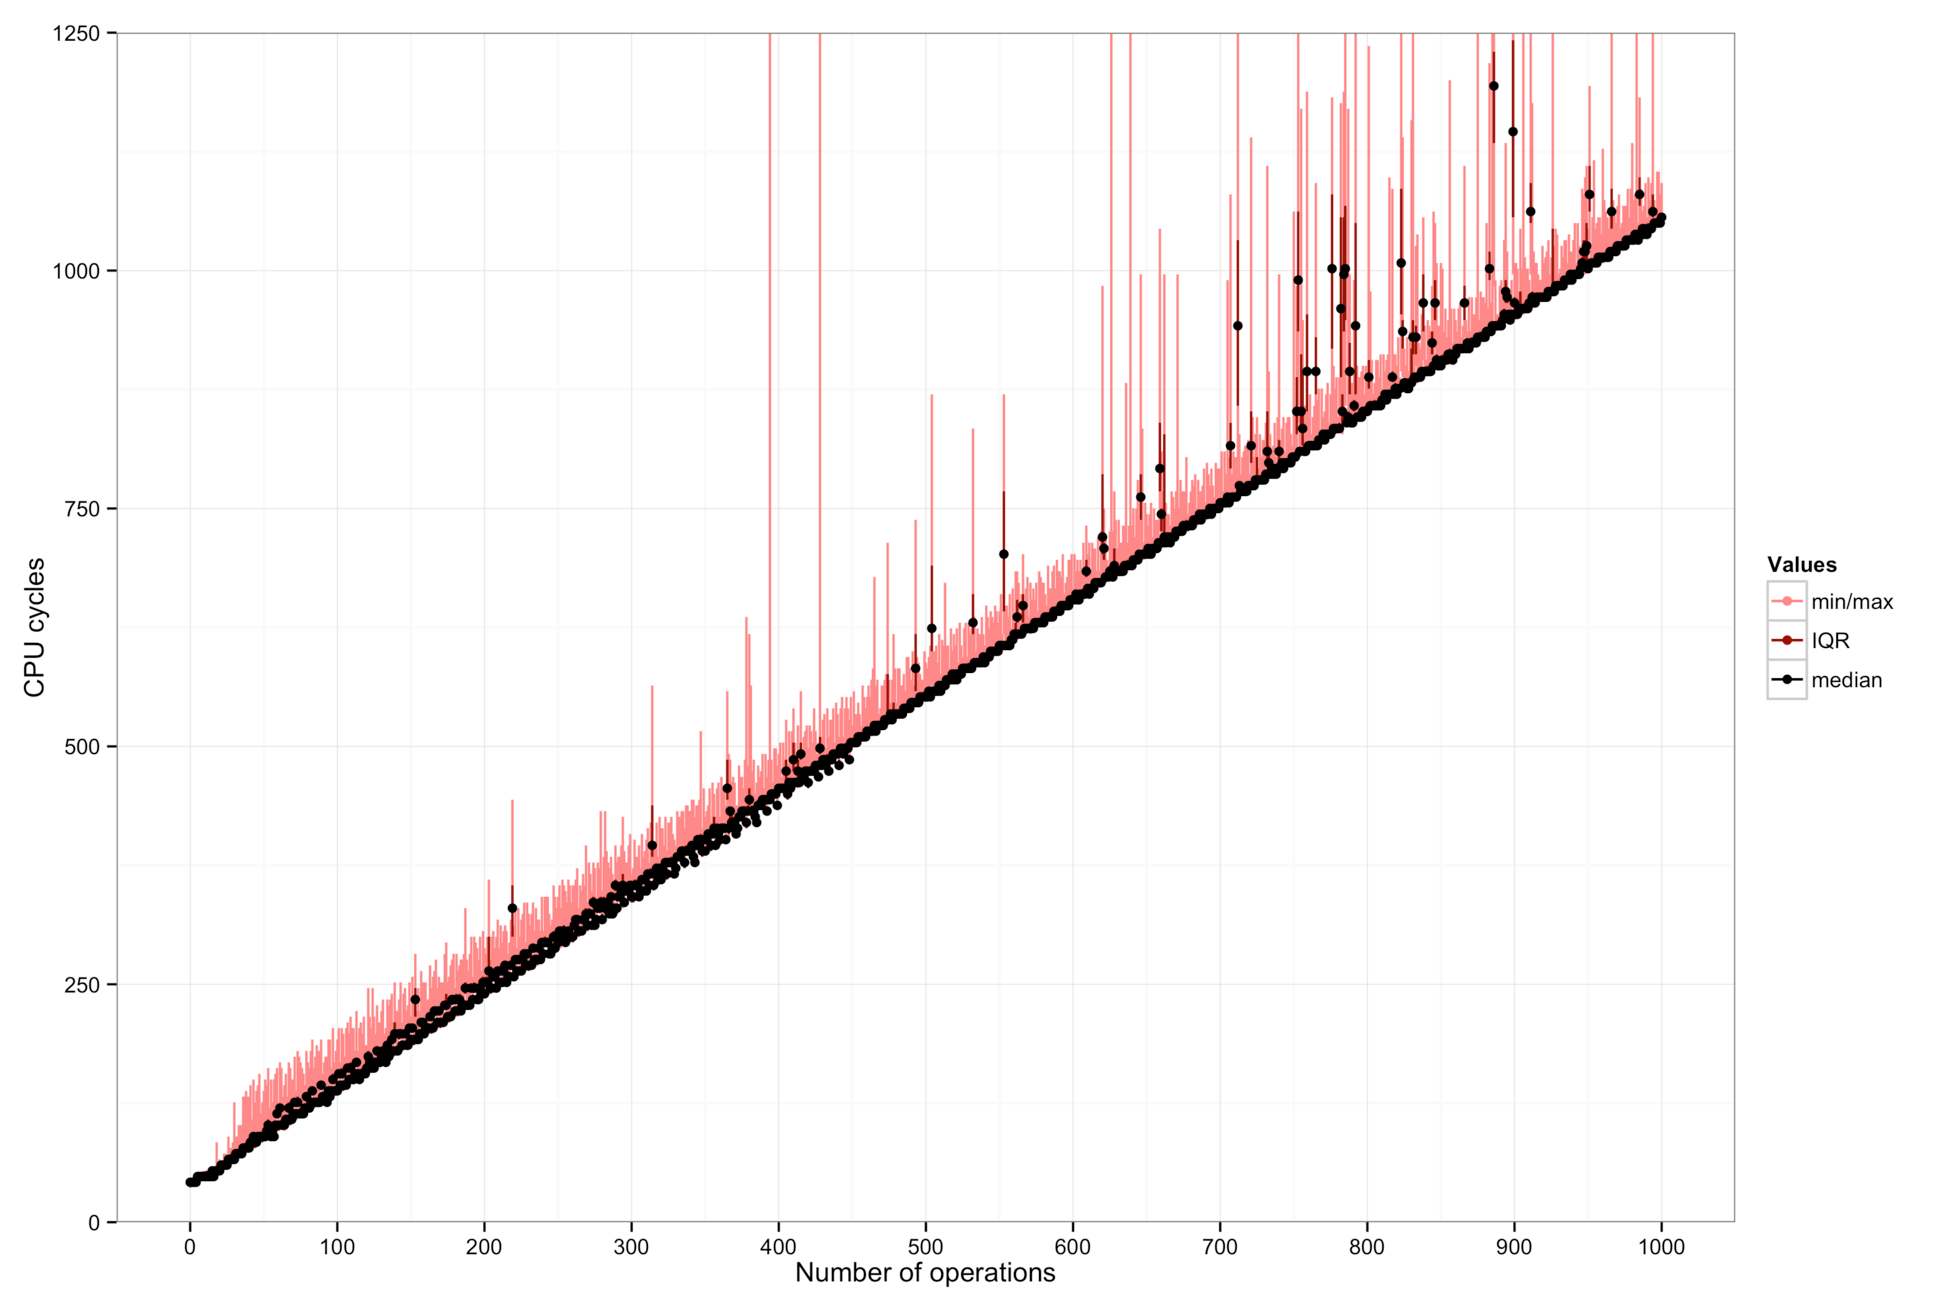
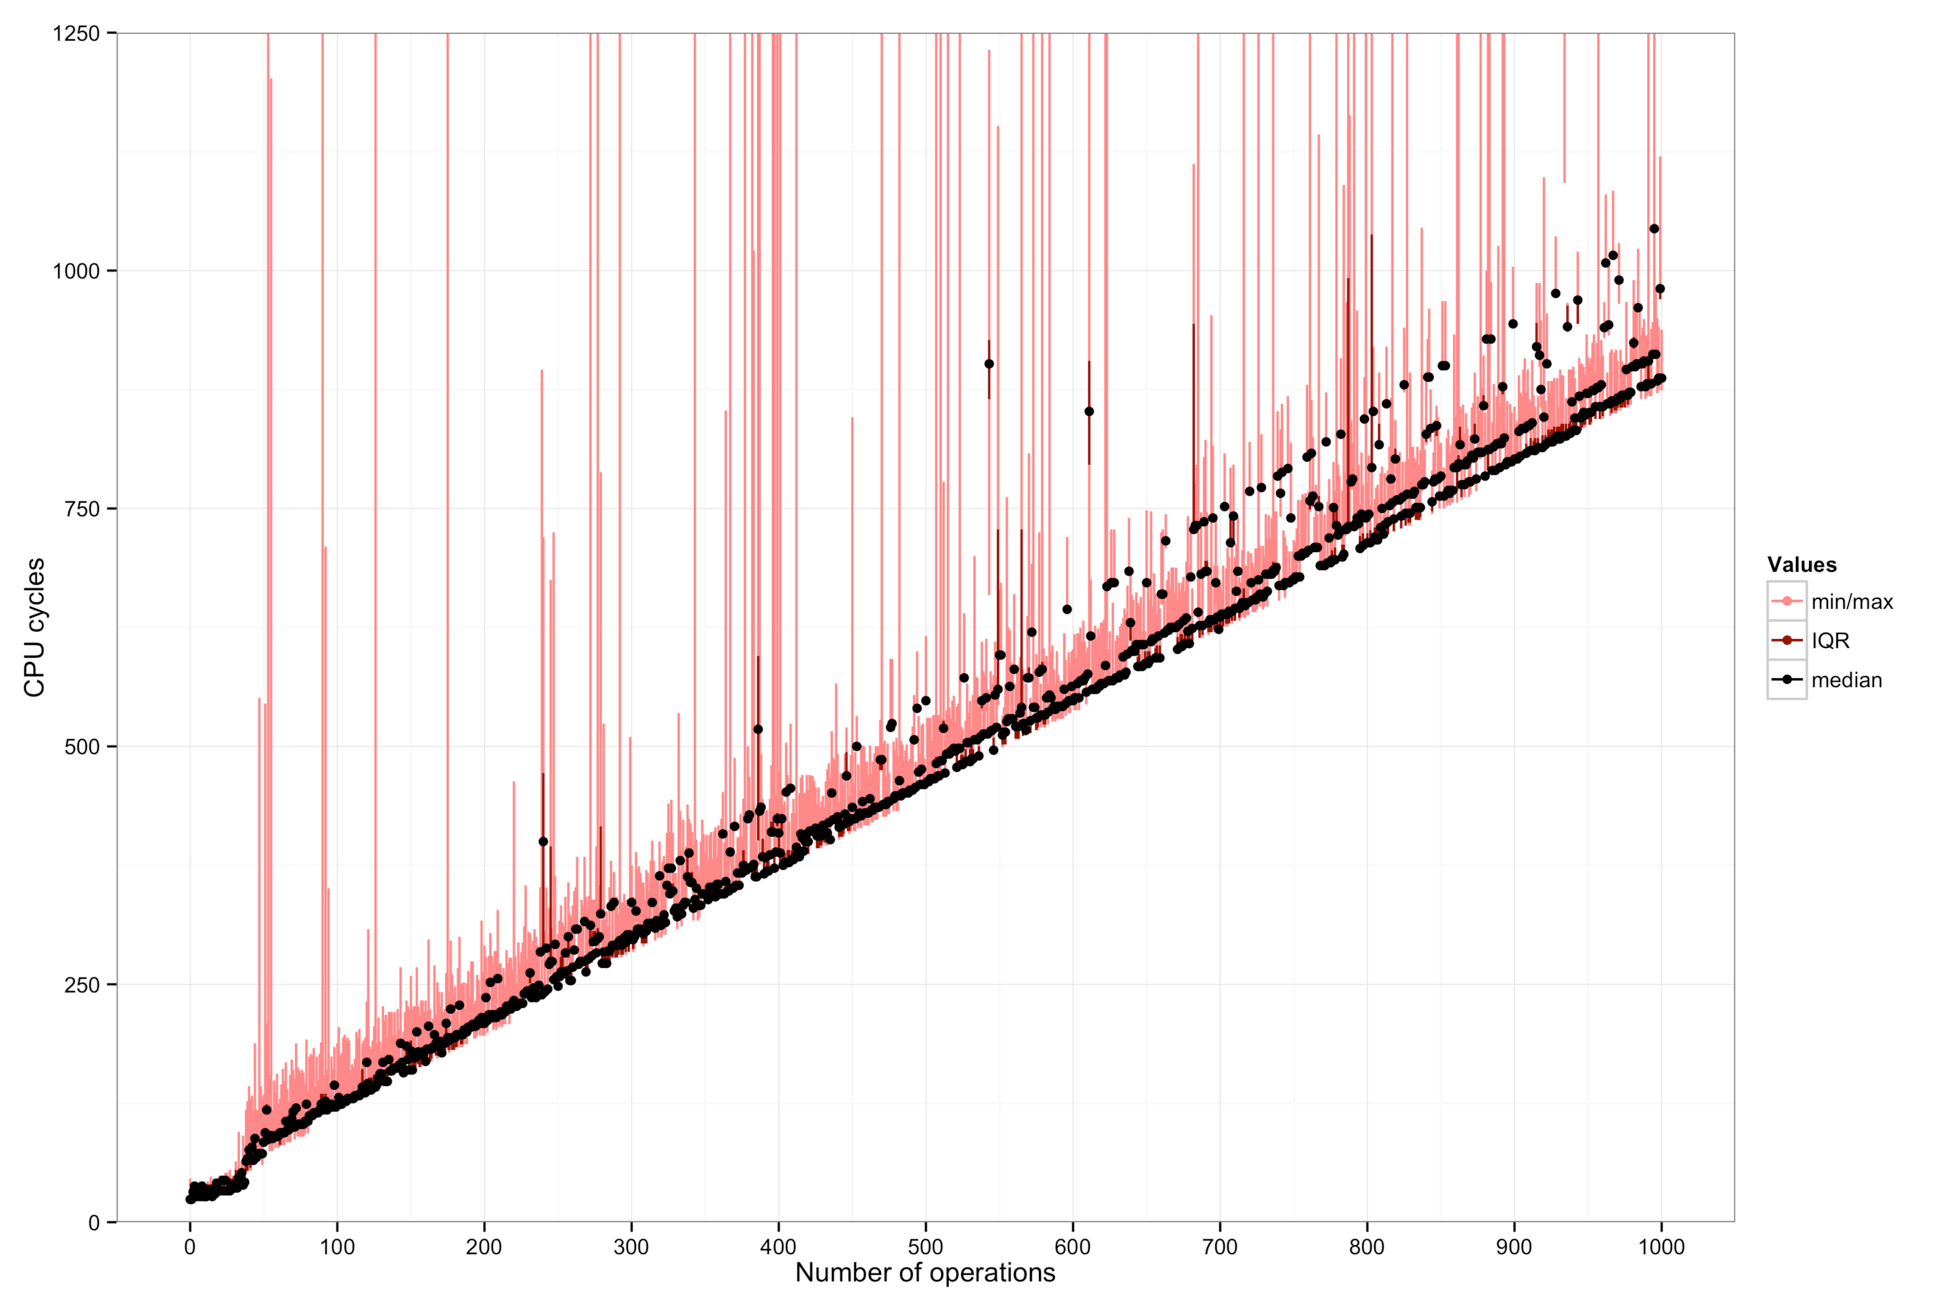
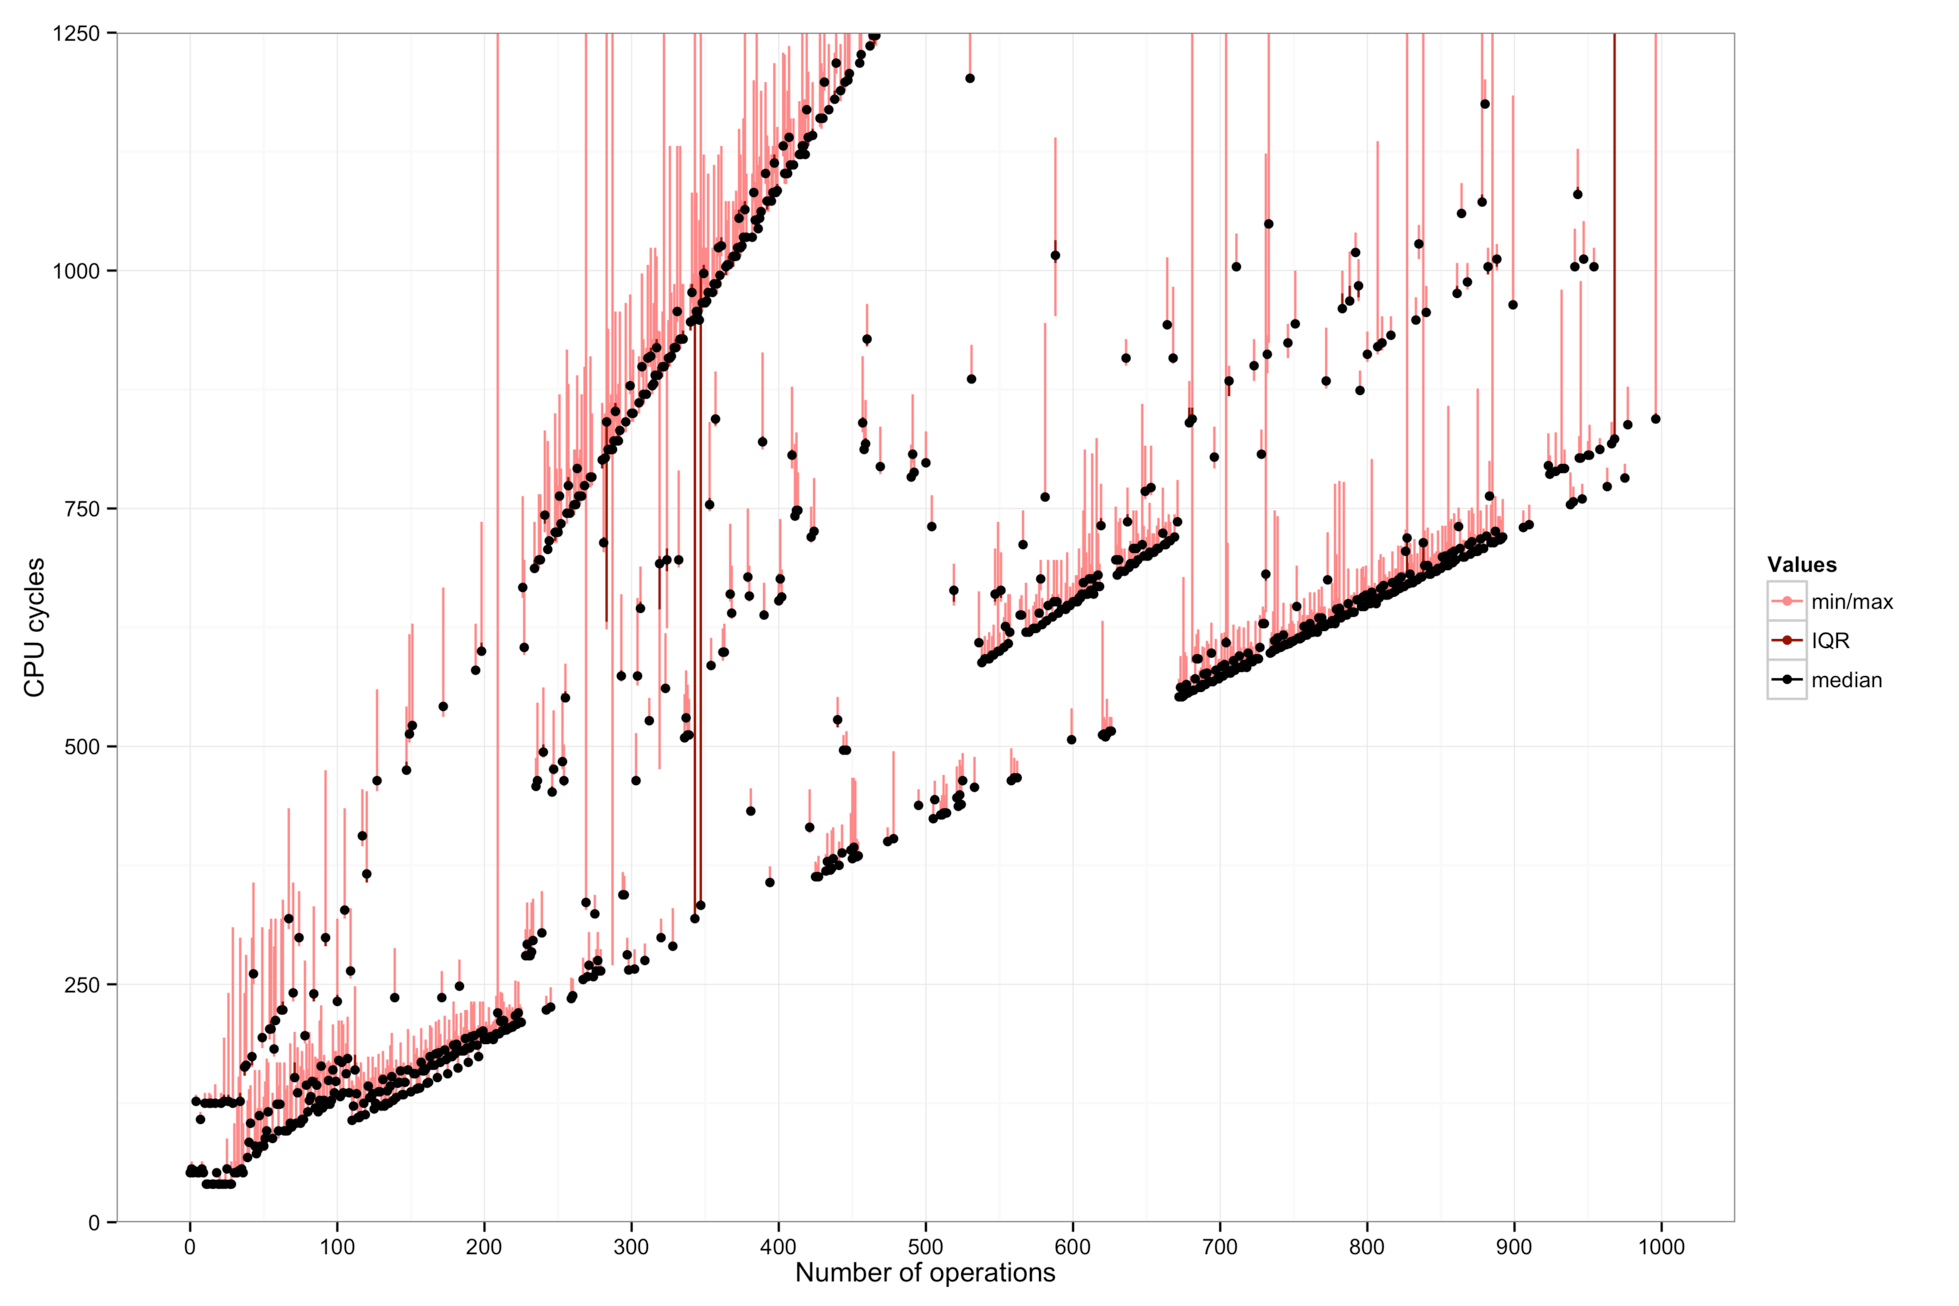
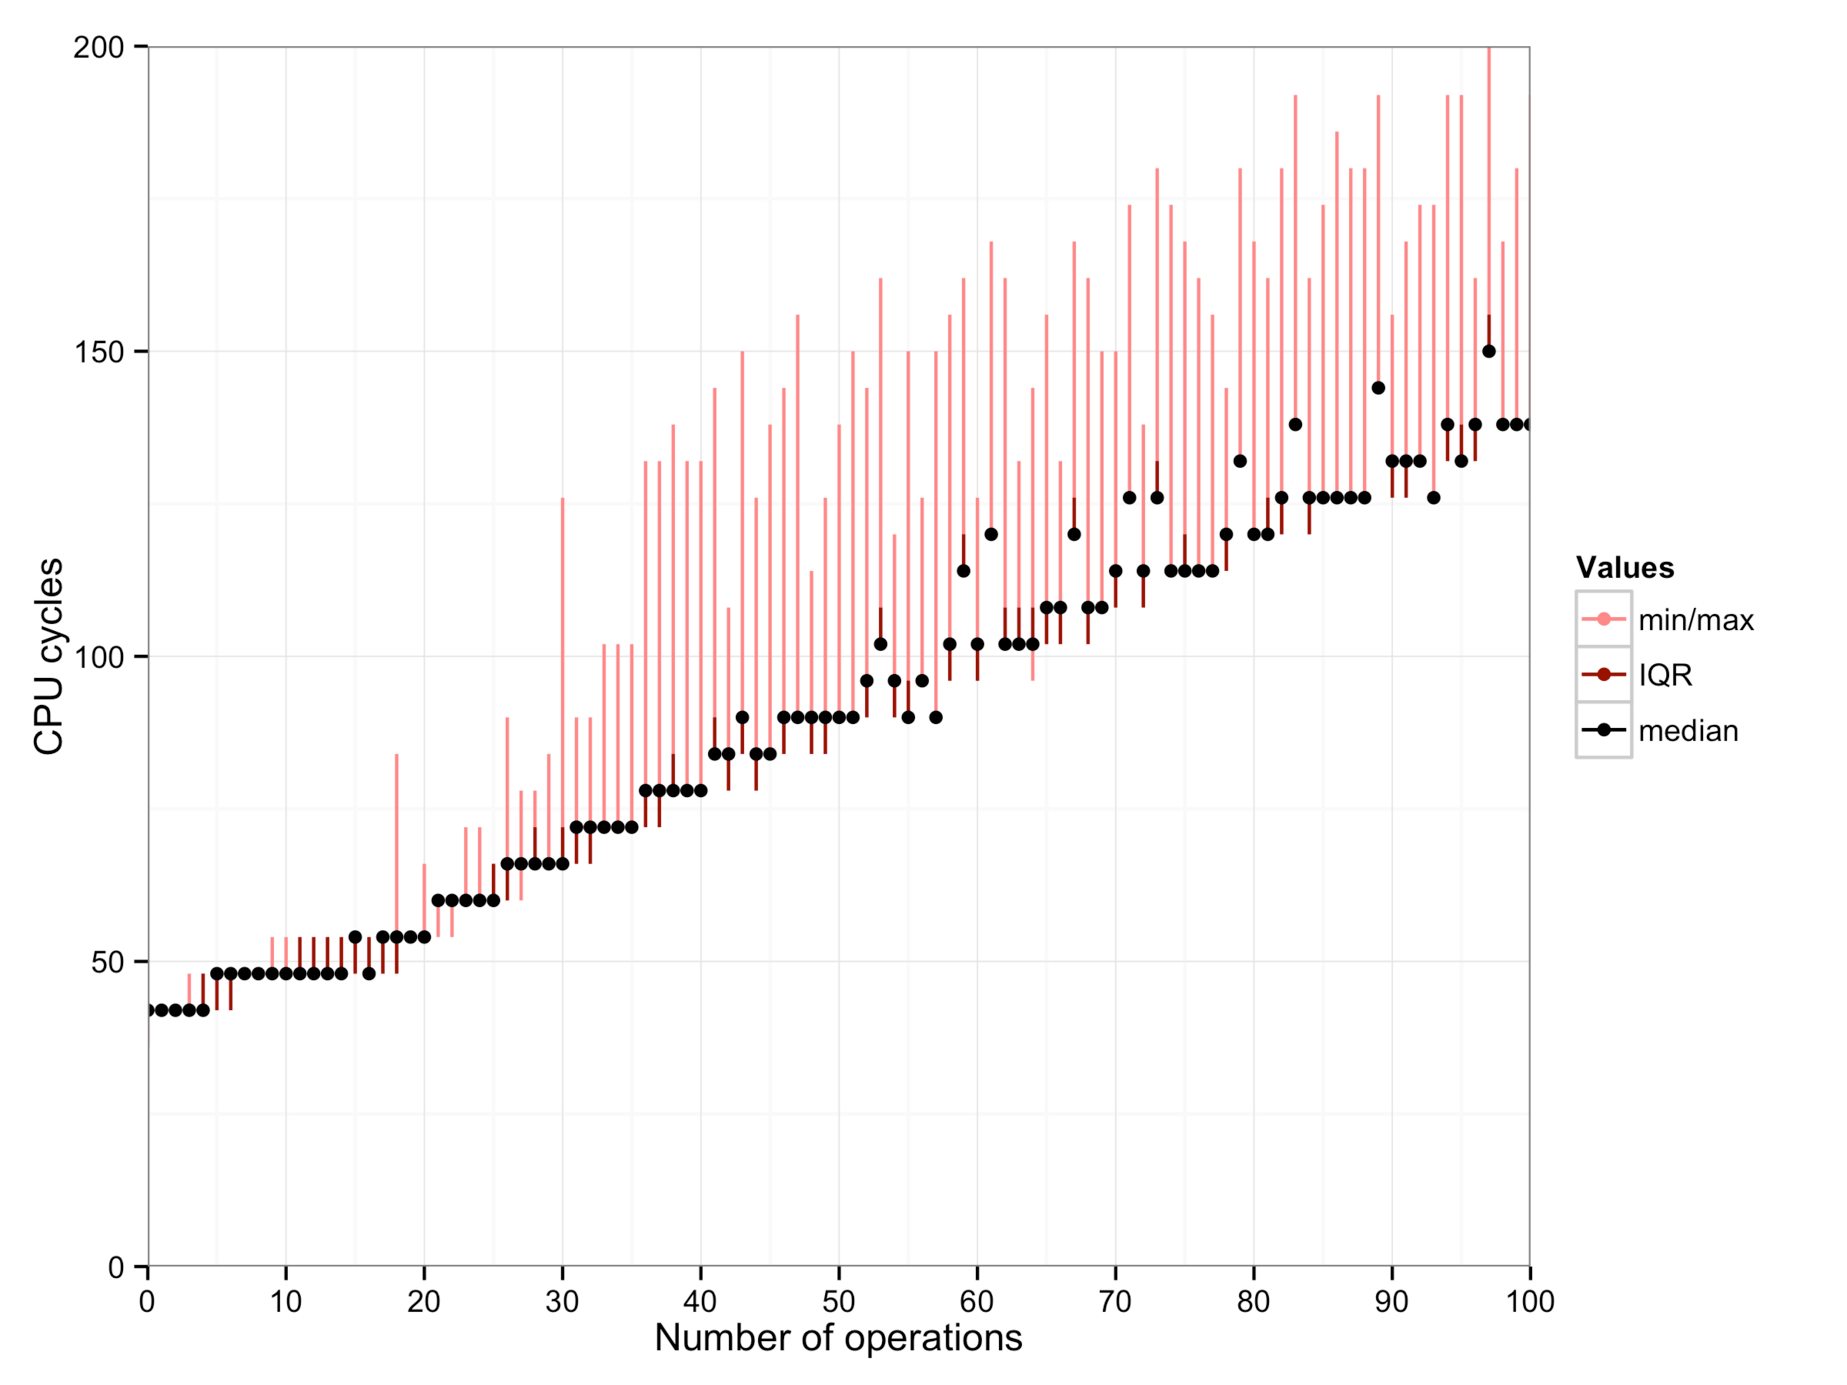
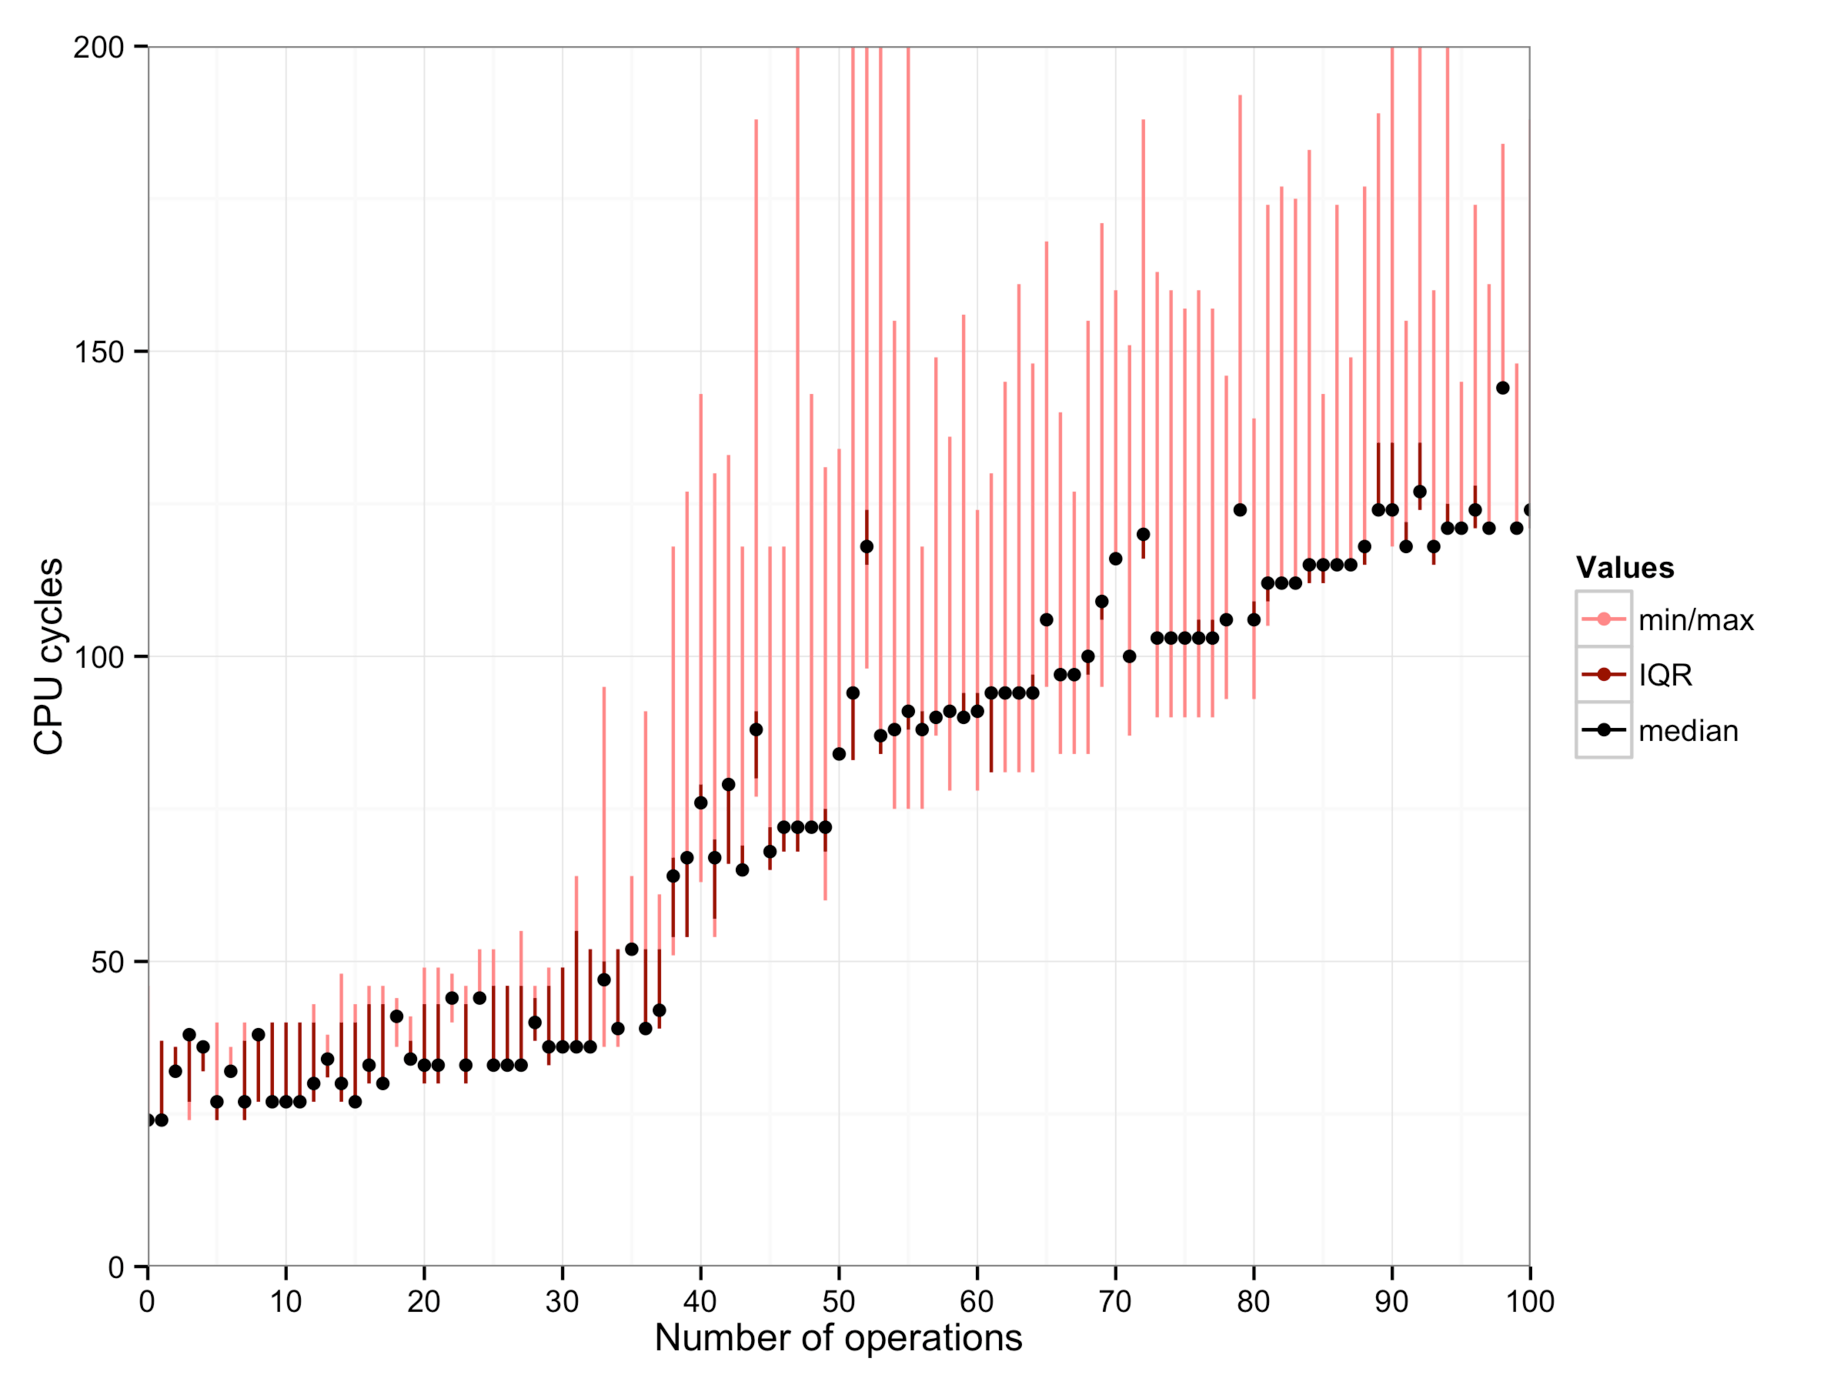
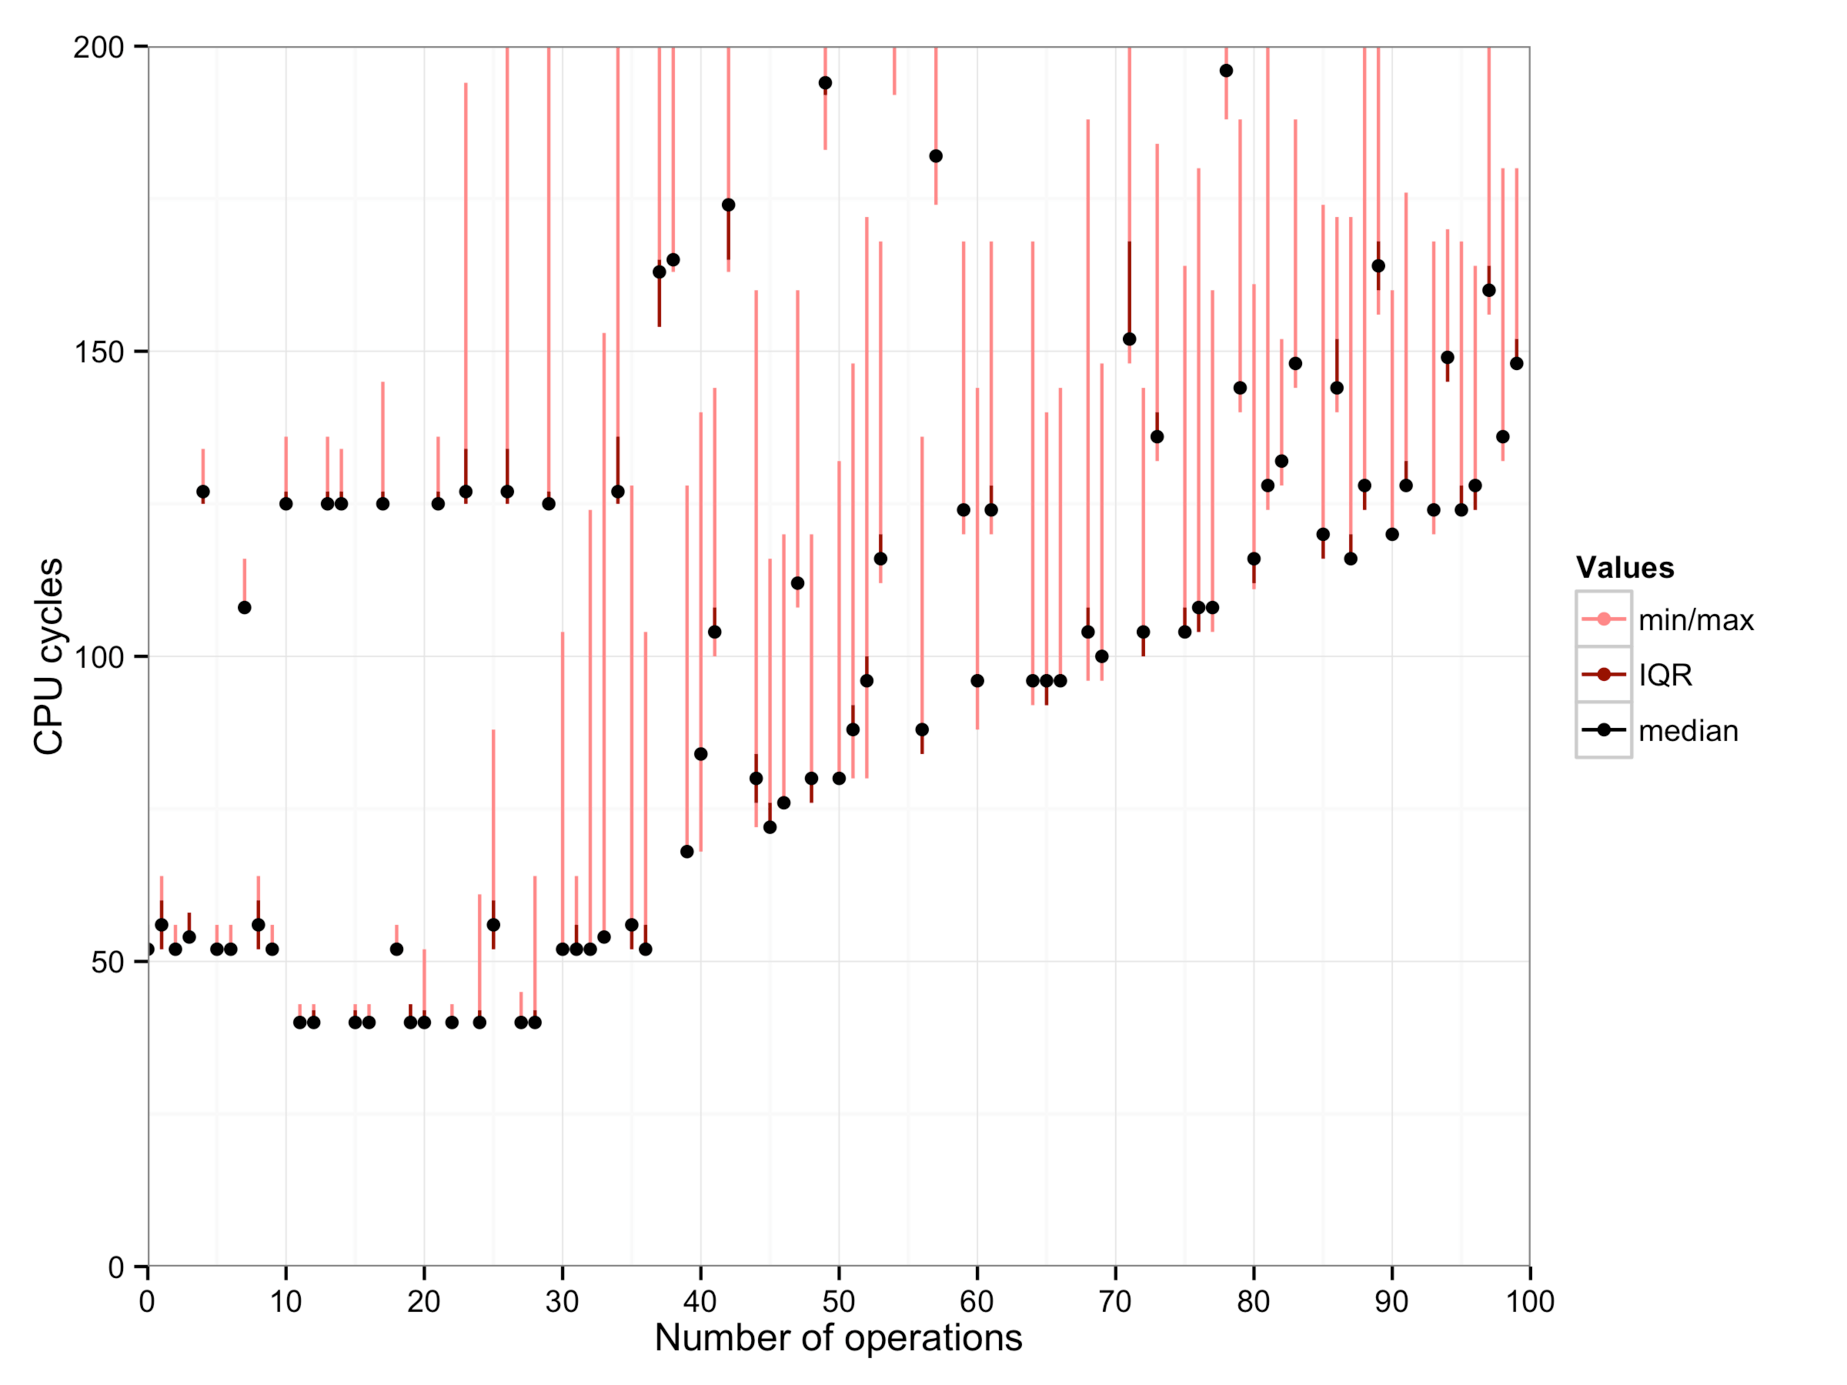
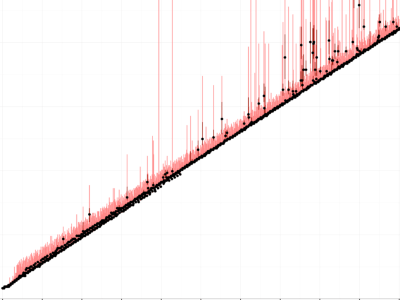
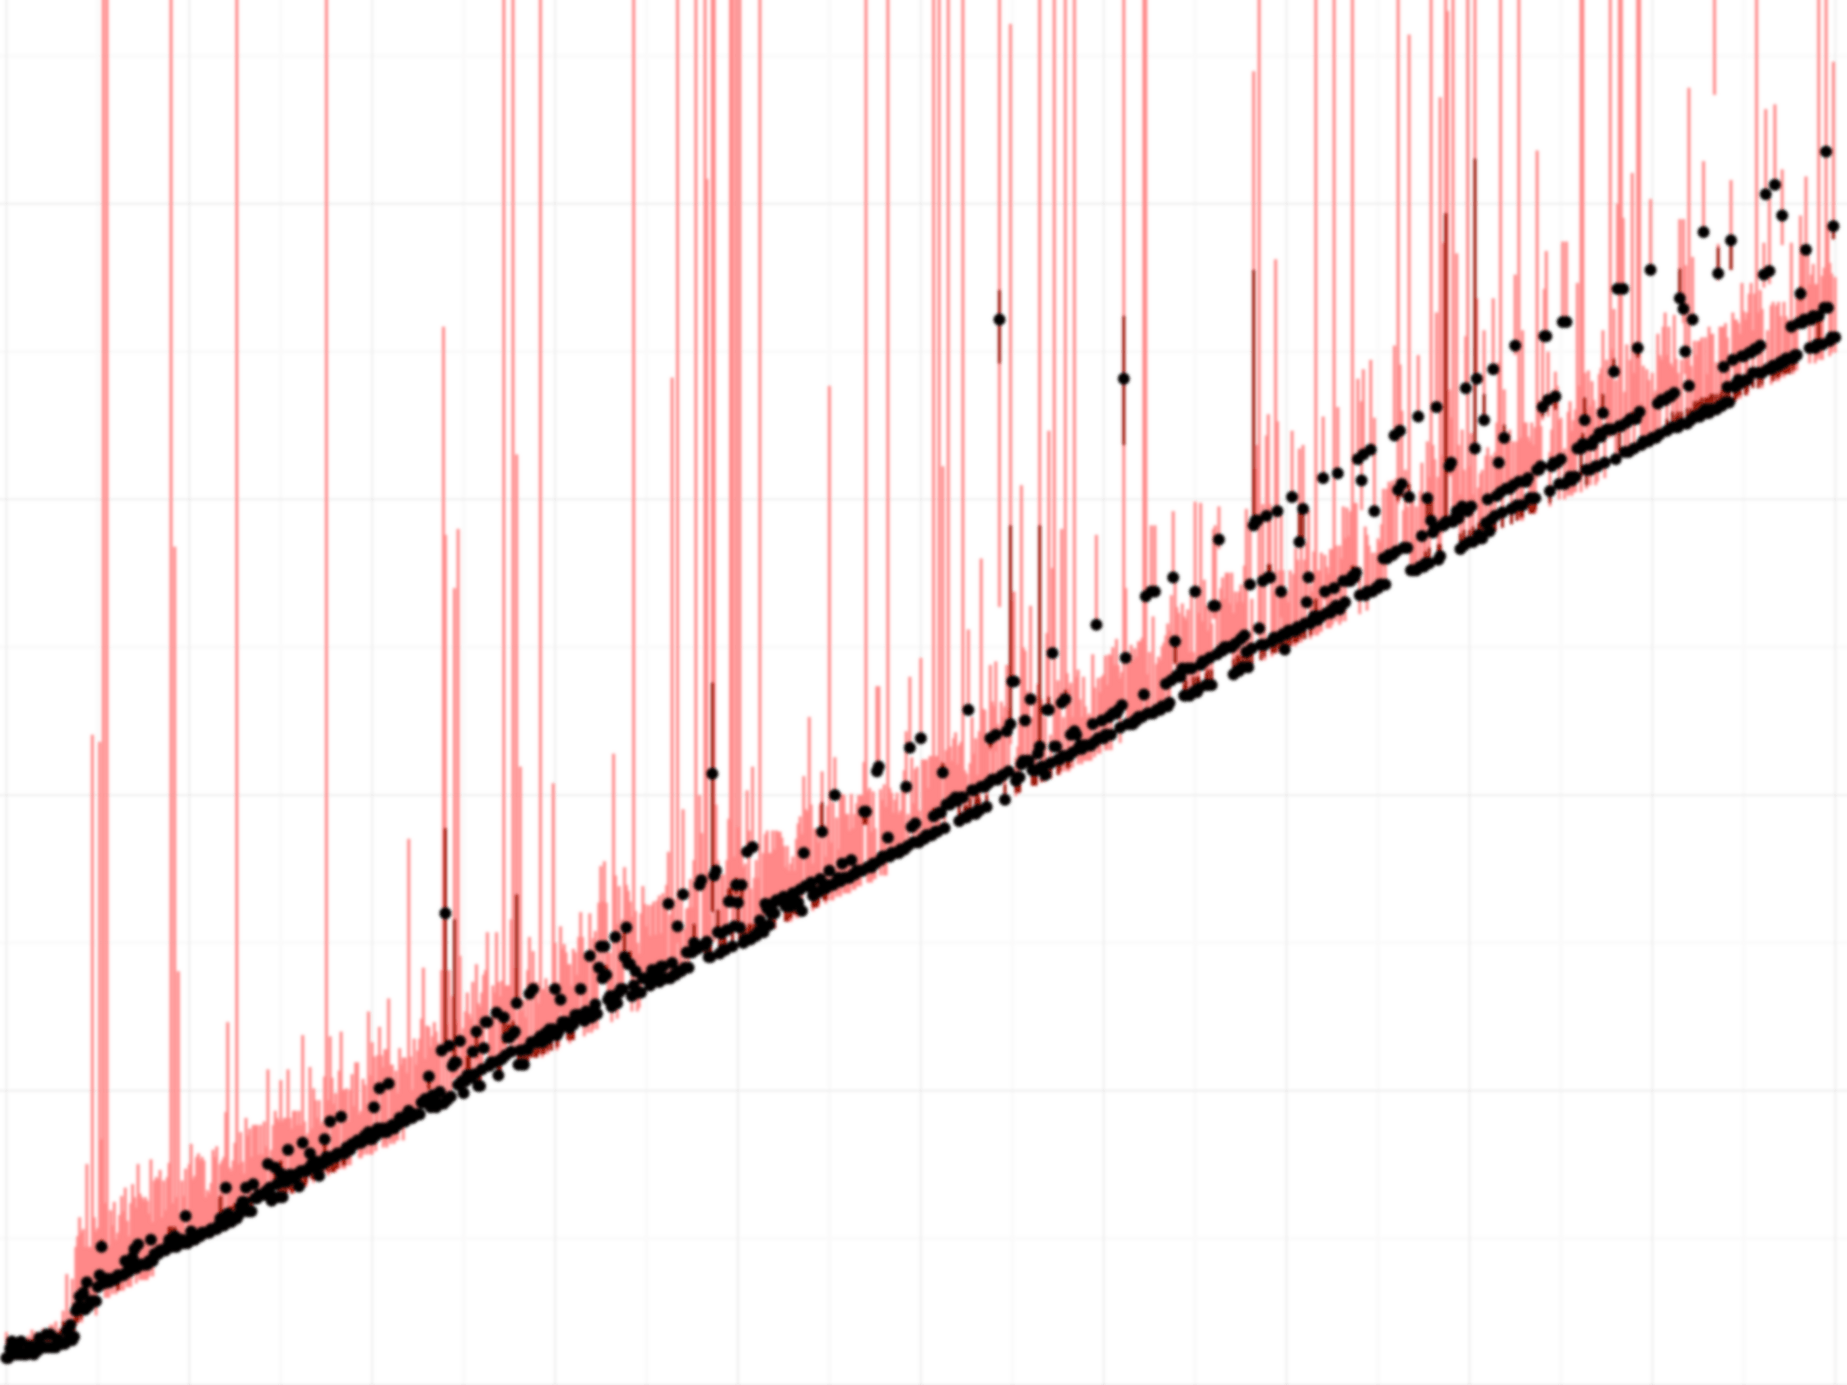
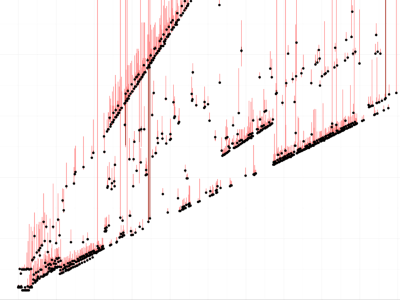
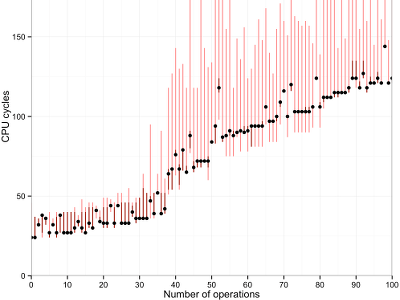
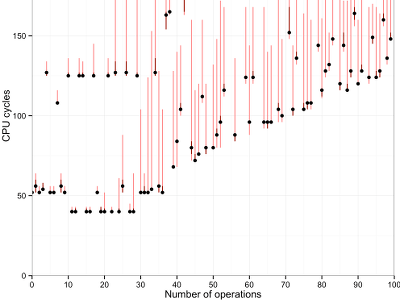
These show, from left to right: a workstation (Intel Xeon E5405 with 8 cores), a Macbook (Intel Core i7-4558U), and a server machine from the DSLab cluster (Intel Xeon E5-2690 with 32 cores).
There are a number of things to observe in the graphs:
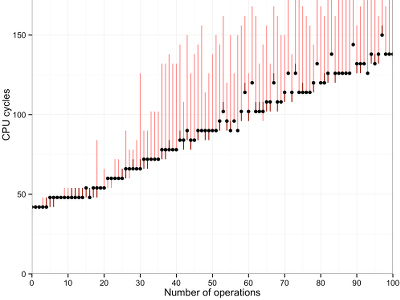
Dots and lines: The dots in this graph show the median of a hundred measurements. Red bars show the maximum and minimum observed values. These can differ significantly, so it is important to filter the data.
There are also some clear outliers, maybe due to interrupts or context switches.
The cost of one “operation” corresponds to the slope(s) of the line(s) in the plot. It depends on the CPU.
- On the workstation, the cost is 1 cycle.
- An operation seems to cost only around 0.84 cycles on the Macbook.
- On the server machine, there are at least three “modes” with costs 0.8, 1.0, or 2.7 cycles.
An “operation”: The benchmark performs one movl instruction per
loop iteration, for a fixed number of iterations. I’ve let the number of
iterations be a compile-time constant, to examine the effects of loop
unrolling. They are particularly visible on the Macbook: Until 37 iterations,
the loop is unrolled completely. An operation costs 0.4 cycles in this case.
For larger numbers, the Clang compiler partially unrolls the loop: For numbers
of operations that are divisible by 2, 3, 4, 5, 6, or 7, it will pack so many
movls in the loop body. Thus it spends less time incrementing the loop
counter.
Minimal granularity: The time stamp counter cannot measure individual cycles on all machines. On the workstation for example, results increase six cycles at a time.
Cost: The intercept (at zero operations) is between 24 (i7) and 36 instructions (Xeon). This is the cost of a single CPU fence and readout of the TSC.
Precision: In my experiment, the precision of the time stamp counter is sufficient to distinguish differences of about 3-5 instructions, except on the server machine where other factors dominate the measurements.
Overhead: The overhead of this measurement method is at least 60 cycles per measurement (since three fences and two TSC readouts are needed), plus additional cost to store the result somewhere. Thus it is a fairly expensive measurement method if one really needs to measure small sections of code.
Where to go from here?
If this post made you want to try out benchmarking using the time stamp counter, you can download my sample code.
There are also other resources and libraries that might be more appropriate, especially if reliability and ease of use are a concern. On Windows, consider using QueryPerformanceCounter. On Unix systems, PAPI provides an interface to the TSC and many other hardware counters.